World Climate Maps
Unlike the climate charts on this site, which are all original, these maps were adapted from others found on the web.
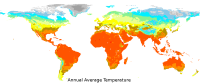
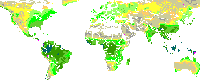
The temperature and rainfall maps are somewhat modified output from climate mapping software available from the UN Food and Agriculture Organization. These are a few years old, I'm not sure what is currently available.
The wind speed map was brought to you in full psychedelic color by NASA "Surface meteorology and Solar Energy: Methodology" which does not seem to be available any more.
Temperature |
Rainfall |
Global Warming |
Wind Speed |
Wind Direction/Vector (Prevailing Winds) |
See the Index Map for a quick interface to the 1000's of climate charts on this site.
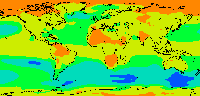
Average Temperature

The original scale units are degrees Centigrade, the conversion to Fahrenheit is approximate.
Total Rainfall
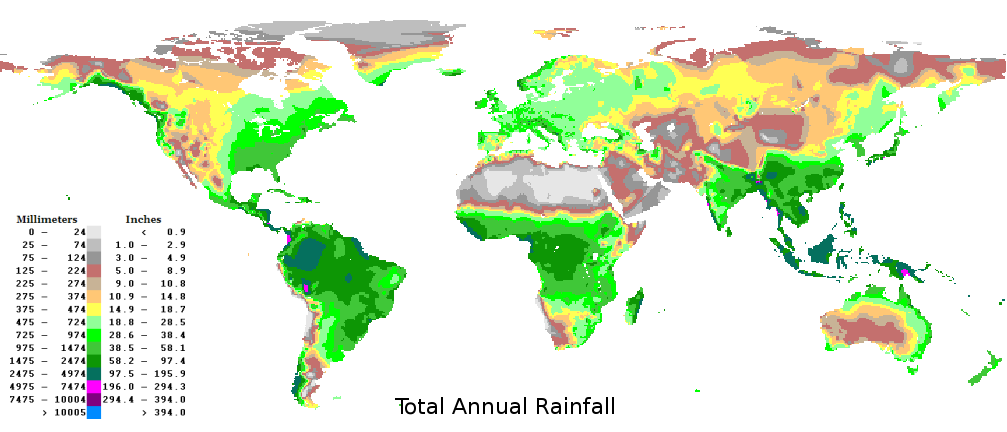
The original scale units are millimeters, the conversion to inches is approximate.
Scroll up to see the Temperature Map.
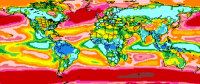
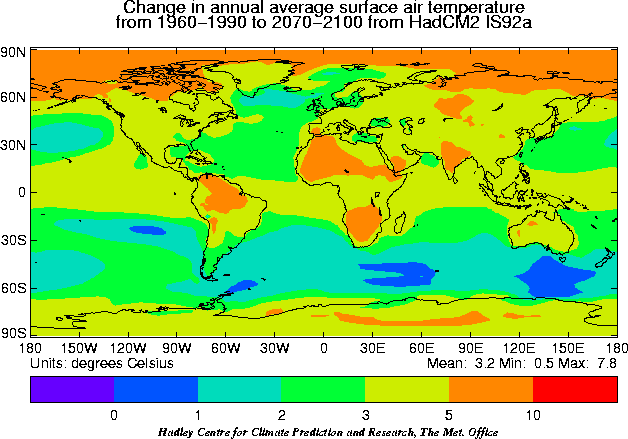
Global Warming
Predicted temperature increase from the baseline period of 1960-1990 to 2070 2100. Originally from From the Hadley Centre but no longer available..
Also see About the Global Warming Data on this site for a discussion of how this map is used in our location pages.
Wind Speed
This is annual average wind speed measured 50 meters above the ground or sea.
|
||||||||||||||||||||||||||||||||||||||||||||||||||||||||||||||||||||||||||||
The original scale units are meters per second, the conversion to miles per hour is approximate.
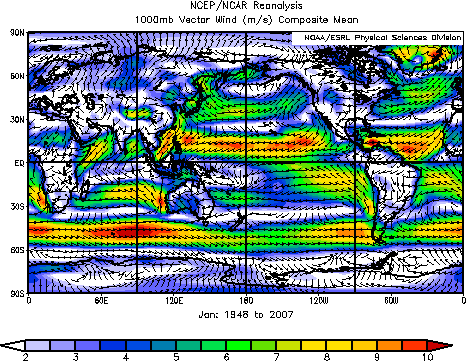
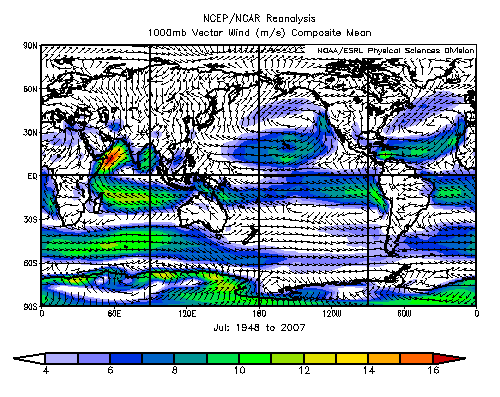
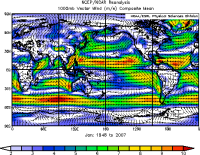
Wind Direction (Vector)
This is average wind, with direction shown by arrows and speed shown by background color. The first is for January, the second is for July. These was from NOAA Earth System Research Laboratory but is no longer available.. Thanks to Andrew Leventis for locating this for me.